

After spending a lot of money on the design and development of the website, what do brands hope for next?
The answer to this question as many of you might already know is quite simple – brands wish to earn money by bringing traffic to the website and converting this traffic to prospective customers.
Now the question is that how to get a website visitor to take an action that leads to conversion?
The solution to this issue can be summed up as follows – you can use heat maps to find out if the visitors are clicking on the call to action buttons that you want them to click on.
You can also see the page area that the visitors click the most and hence you can highlight it even more, to grab the attention of other users.
On the other hand you can remove content that is seeing no clicks and replace it with something that will add value to your business.
So before we jump to how you can use heat maps to increase conversions, let us get more understanding of heat maps and how they can be generated on a webpage.
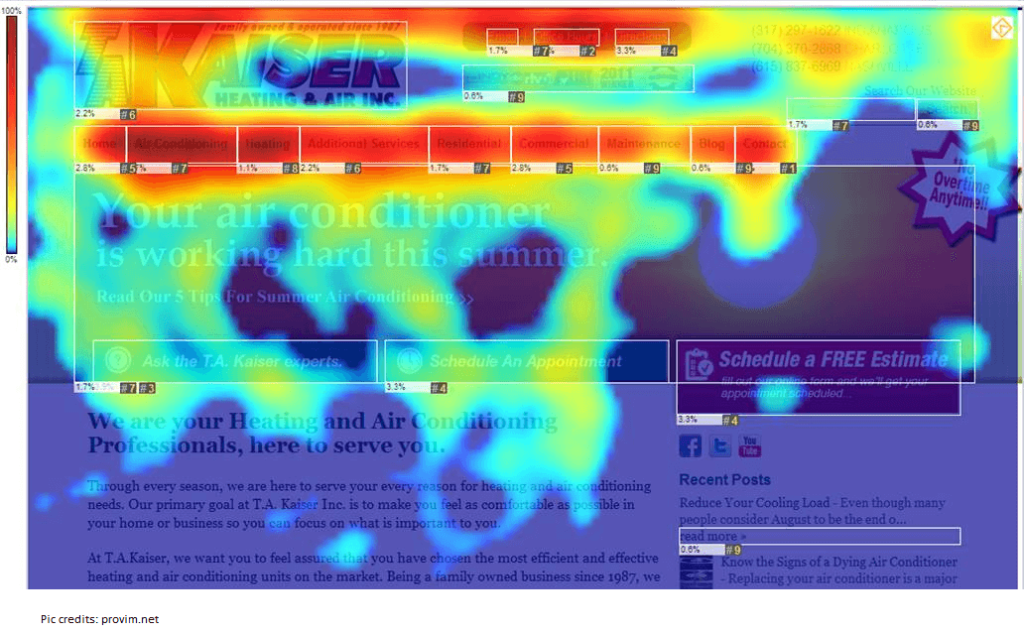
What are heat maps?
A heat map is a form of visual analytics. In other words it is a two dimensional representation of data, but the data here is represented in the form of colours rather than numbers.
For a website, heat maps show how visitors interact with the information and the graphic elements present on the web pages.
The basic difference in between visual analytics and analysing numbers and data is that, while the latter tells you only about the pages that are under-performing, the former shows you which elements on the page need adjustment so that you can maximize their performance.
How heat maps are generated for a web page?

Heat maps can be easily generated by using click tracking software that translates where a user clicks his mouse button, into a two-dimensional coloured visual.
Below we have explained a bit about the different types of heat maps –
Mouse-movement heat map

It shows the pattern of how the user navigates through the page. Apart from this, it also shows the area over which most of the users hover and thus it helps you in seeing the area that gets the most attention.
Scroll map

It shows the point at which the visitors abandon the page as they scroll through the content. It provides insight about how to adjust the length of the content and where to place the calls- to-action to maximize the effectiveness of your web pages.
Click map

It shows the area where the visitors are clicking so that you can remove the distracting links and direct the visitors’ attention to calls-to-action that are critical for conversion.
Eye-tracking heat map
It points out the exact area where the visitors gaze falls on the web page.
Why you should use heat maps?
Heat maps help you learn a lot about user behaviour. You get to learn about what users focus the most on and also how they react to the calls-to-action.
Heat maps provide you with real-life data from your ideal customers and thus help you out in maximizing your results.
With the help of the data pointed out through these maps you can transform the graphic layout and the user experience of your website to increase the conversion rate. Another major advantage of heat maps is that they are incredibly cheap to create.
Let us further discuss the ways in which you can use heat maps to increase the conversion rate of your website –
Analyse what content is of interest to users

Not all conversions happen because the user clicks on a call-to-action. Some conversion happens due to the quality of your content too. To deduce the type of content your users get attracted to, use a mouse-tracking map and observe where your cursor stops.
This will help you in analysing the type of content that users prefer.
Optimize placement of call-to-action

Heat maps will help you identify the areas that your website visitors place their cursors on and these are the areas that you should focus on.
Hence, you should place your call-to-action buttons in these areas that attract the visitors of the website.
Streamline the page design

Heat maps shall also help you identify the areas that are getting little or no attention. To find out these areas you can use mouse-tracking maps and click on them to identify content that receives little attention.
It will be best for you to remove these areas from the web pages as they also distract the visitors from the calls-to-action that lead to conversion.
Reduce cart abandonment

Use the heat maps to find out where the visitors are clicking on the shopping cart page. Analyse the following points
- What did the visitors click on if they did not click on the checkout button?
- Can any of those elements be eliminated or repositioned to divert more attention on the checkout button?
- Were the visitors easily able to locate the checkout button?
Once you’ve analysed and fixed all these issues there is a strong chance that conversion rates of your website won’t increase.
Optimize content

Use the scroll map to see where exactly do the visitors tend to read the content.
Once you’ve figured that out make sure that all your calls-to-action are placed above the point where the users tend to leave the page.
Replace the dead-ends with call-to-action

Does the point where your content ends has some calls-to-action buttons or is it a dead-end?
A dead-end not only decreases the user experience but you also tend to lose the chance of further engaging the users with your website.
A heat map can help you figure out such dead-ends so that you can add a call-to-action to it and thus increase the effectiveness of your content.
Make the maximum use out of the images


With heat maps you can also check the effectiveness of the images placed on the website.
It has been observed that the right placement of the image focuses the attention of the user to text and call-to-action buttons.
This is demonstrated quite well by the above image – Text and call-to-action gets more attention when the baby’s gaze is directed to the area on the page as compared to when the gaze is towards the audience.
Do you also want to use heat maps on your website to enhance the user experience and increase the conversion rate?
If so, then contact Queppelin today and we’ll do the math for you.